 Catalogue PIGMA
Canary Current system
Type of resources
Available actions
Topics
Keywords
Contact for the resource
Provided by
Years
Formats
Representation types
Update frequencies
status
Scale
Resolution
-

The Sea Around Us is a research initiative at The University of British Columbia (located at the Institute for the Oceans and Fisheries, formerly Fisheries Centre) that assesses the impact of fisheries on the marine ecosystems of the world, and offers mitigating solutions to a range of stakeholders. The Sea Around Us was initiated in collaboration with The Pew Charitable Trusts in 1999, and in 2014, the Sea Around Us also began a collaboration with The Paul G. Allen Family Foundation to provide African and Asian countries with more accurate and comprehensive fisheries data. It provides data and analyses through View Data, articles in peer-reviewed journals, and other media (News). We regularly update our products at the scale of countries’ Exclusive Economic Zones, Large Marine Ecosystems, the High Seas and other spatial scales, and as global maps and summaries. It emphasises catch time series starting in 1950, and related series (e.g., landed value and catch by flag state, fishing sector and catch type), and fisheries-related information on every maritime country (e.g., government subsidies, marine biodiversity). Information is also offered on sub-projects, e.g., the historic expansion of fisheries, the performance of Regional Fisheries Management Organizations, or the likely impact of climate change on fisheries. The information and data presented on this website is freely available to any user, granted that its source is acknowledged. We are aware that this information may be incomplete. Please let us know about this via the feedback options available on this website.
-
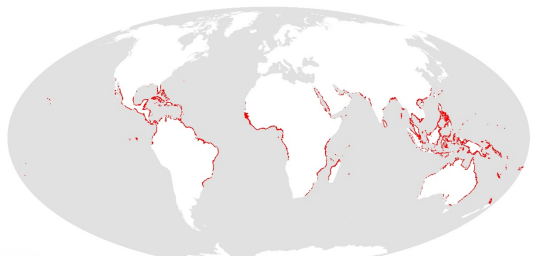
This dataset shows the global distribution of mangroves, and was produced as joint initiatives of the International Tropical Timber Organization (ITTO), International Society for Mangrove Ecosystems (ISME), Food and Agriculture Organization of the United Nations (FAO), UN Environment World Conservation Monitoring Centre (UNEP-WCMC), United Nations Educational, Scientific and Cultural Organization’s Man and the Biosphere Programme (UNESCO-MAB), United Nations University Institute for Water, Environment and Health (UNU-INWEH) and The Nature Conservancy (TNC). Major funding was provided by ITTO through a Japanese Government project grant; the project was implemented by ISME.
-
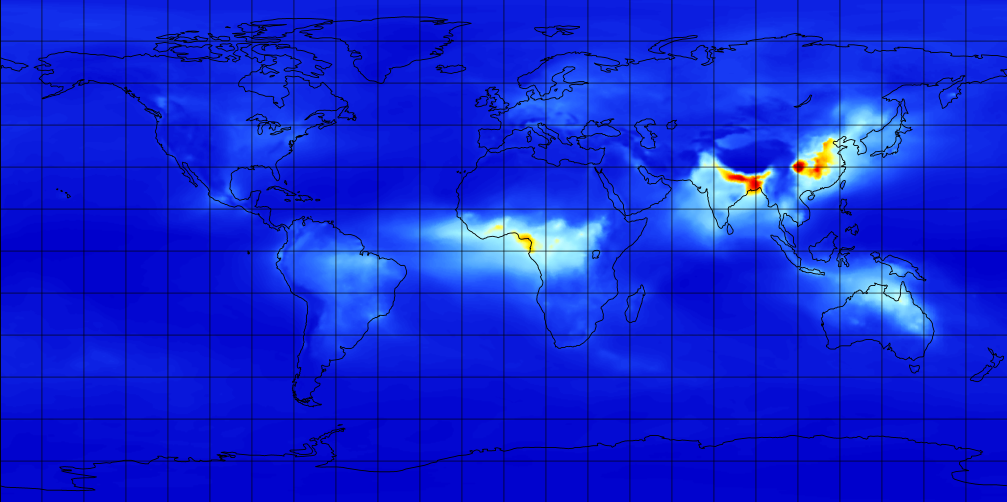
M2TMNXAER (or tavgM_2d_aer_Nx) is a time-averaged 2-dimensional monthly mean data collection in Modern-Era Retrospective analysis for Research and Applications version 2 (MERRA-2). This collection consists of assimilated aerosol diagnostics, such as column mass density of aerosol components (black carbon, dust, sea salt, sulfate, and organic carbon), surface mass concentration of aerosol components, and total extinction (and scattering ) aerosol optical thickness (AOT) at 550 nm. The total PM1.0, PM2.5, and PM10 may be derived with the formula described in the FAQs under the Documentation tab of this page. The collection also includes variance of certain parameters. MERRA-2 is the latest version of global atmospheric reanalysis for the satellite era produced by NASA Global Modeling and Assimilation Office (GMAO) using the Goddard Earth Observing System Model (GEOS) version 5.12.4. The dataset covers the period of 1980-present with the latency of ~3 weeks after the end of a month.
-
FishStatJ is a Windows and Mac application that anyone can use to access FAO’s Fisheries and Aquaculture statistics. They include datasets on production, trade and consumption. Data can be extracted and aggregated according to different level of details and international standard classifications. It consists of a main application and several workspaces that include the datasets.
-

All statistics of UNCTAD are harmonized and integrated into UNCTADstat- free to use dissemination platform. It gives access to basic and derived indicators built upon common rules, harmonized environment and clear methodology supported by powerful data browsing system. The statistical series are regularly updated and classified into easy-to-navigate themes. UNCTADstat offers ready-to-use analytical groupings, with a unique coverage for countries and products and a particular focus on developing and transition economies. This approach ensures data consistency across multiple data series, and enables users to harness its full potential by mixing and matching data from various domains. The navigation browser allows table or graphic presentations, easy selection and reorganization of data, personalized functionalities and several straightforward extraction options.
-

MISSION ATLANTIC assesses the whole Atlantic, and ecosystem components at risk from natural hazards and the consequences of human activities, including individual regional Case Studies, and their interconnectivity. To do this, Mission Atlantic develops IEAs for seven regional Case Studies, in sub-Arctic and Tropical regions of the Atlantic Ocean, ranging from shelf seas to the mid-Atlantic Ridge: 1) Norwegian Sea 2) Celtic Sea 3) Canary Current 4) North Mid Atlantic Ridge 5) South Mid Atlantic Ridge 6) Benguela Current 7) South Brazilian Shelf
-

NCAR was established by the National Science Foundation in 1960 to provide the university community with world-class facilities and services that were beyond the reach of any individual institution. More than a half-century later, we are still delivering on that mission. NCAR provides the atmospheric and related Earth system science community with state-of-the-art resources, including supercomputers, research aircraft, sophisticated computer models, and extensive data sets. From its founding, NCAR was meant to provide the atmospheric research community with the shared resources necessary to work on the most important scientific problems of the day. Not much has changed. The hundreds of scientists who work here research all things atmospheric — which includes everything from the microphysics of cloud formation and the chemistry of air pollution to large-scale planetary waves and the impact of increased greenhouse gases on our climate. Since the atmosphere interacts with everything it touches, its crucial to investigate those interactions, too.
-
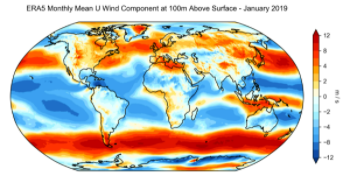
ERA5 is the fifth generation ECMWF reanalysis for the global climate and weather for the past 4 to 7 decades. Currently data is available from 1950, split into Climate Data Store entries for 1950-1978 (preliminary back extension) and from 1979 onwards (final release plus timely updates, this page). ERA5 replaces the ERA-Interim reanalysis. Reanalysis combines model data with observations from across the world into a globally complete and consistent dataset using the laws of physics. This principle, called data assimilation, is based on the method used by numerical weather prediction centres, where every so many hours (12 hours at ECMWF) a previous forecast is combined with newly available observations in an optimal way to produce a new best estimate of the state of the atmosphere, called analysis, from which an updated, improved forecast is issued. Reanalysis works in the same way, but at reduced resolution to allow for the provision of a dataset spanning back several decades. Reanalysis does not have the constraint of issuing timely forecasts, so there is more time to collect observations, and when going further back in time, to allow for the ingestion of improved versions of the original observations, which all benefit the quality of the reanalysis product. ERA5 provides hourly estimates for a large number of atmospheric, ocean-wave and land-surface quantities. An uncertainty estimate is sampled by an underlying 10-member ensemble at three-hourly intervals. Ensemble mean and spread have been pre-computed for convenience. Such uncertainty estimates are closely related to the information content of the available observing system which has evolved considerably over time. They also indicate flow-dependent sensitive areas. To facilitate many climate applications, monthly-mean averages have been pre-calculated too, though monthly means are not available for the ensemble mean and spread. ERA5 is updated daily with a latency of about 5 days (monthly means are available around the 6th of each month). In case that serious flaws are detected in this early release (called ERA5T), this data could be different from the final release 2 to 3 months later. So far this has not been the case and when this does occur users will be notified. The data set presented here is a regridded subset of the full ERA5 data set on native resolution. It is online on spinning disk, which should ensure fast and easy access. It should satisfy the requirements for most common applications. An overview of all ERA5 datasets can be found in this article. Information on access to ERA5 data on native resolution is provided in these guidelines. Data has been regridded to a regular lat-lon grid of 0.25 degrees for the reanalysis and 0.5 degrees for the uncertainty estimate (0.5 and 1 degree respectively for ocean waves). There are four main sub sets: hourly and monthly products, both on pressure levels (upper air fields) and single levels (atmospheric, ocean-wave and land surface quantities). The present entry is "ERA5 monthly mean data on single levels from 1979 to present".
-
The World Bank Group works in every major area of development. It provides a wide array of financial products and technical assistance, and it helps countries share and apply innovative knowledge and solutions to the challenges they face.
-

This dataset shows the global distribution of seagrasses, and is composed of two subsets of point and polygon occurrence data. The data were compiled by UN Environment World Conservation Monitoring Centre in collaboration with many collaborators (e.g. Frederick Short of the University of New Hampshire), organisations (e.g. OSPAR), and projects (e.g. the European project Mediterranean Sensitive Habitats “Mediseh”), across the globe (full list available in accompanying metadata table within the dataset).